eeroVista
Read-only monitoring for Eero mesh networks
Getting Started with eeroVista
This guide will help you set up and run eeroVista for the first time.
Prerequisites
- Docker and Docker Compose installed
- An Eero mesh network with mobile app access
- Access to receive SMS verification codes
Installation
Method 1: Docker Compose (Recommended)
- Clone the repository:
git clone https://github.com/yeraze/eerovista.git cd eerovista - Create data directory:
mkdir data - Start the container:
docker compose up -d - View logs:
docker compose logs -f eerovista
Method 2: Docker Run
docker run -d \
  --name eerovista \
  -p 8080:8080 \
  -v $(pwd)/data:/data \
  --restart unless-stopped \
  eerovista:latest
Initial Setup
First Run Wizard
-
Open your browser to
http://localhost:8080(or your server’s IP) - You’ll be prompted to authenticate with Eero:
- Enter the phone number associated with your Eero account
- Click “Send Verification Code”
- Enter the 6-digit code received via SMS
- Click “Verify”
- Once authenticated, eeroVista will:
- Discover your Eero network(s)
- Identify all mesh nodes
- Begin collecting device metrics
- Start populating the database
- Allow 2-3 minutes for initial data collection before viewing the dashboard
Configuration
Environment Variables
Edit docker-compose.yml to customize collection intervals and retention:
environment:
  # Collection intervals (seconds)
  - COLLECTION_INTERVAL_DEVICES=30      # How often to collect device metrics
  - COLLECTION_INTERVAL_NETWORK=60      # How often to collect network metrics

  # Data retention (days)
  - DATA_RETENTION_RAW_DAYS=7           # Keep raw data for 7 days
  - DATA_RETENTION_HOURLY_DAYS=30       # Keep hourly aggregates for 30 days
  - DATA_RETENTION_DAILY_DAYS=365       # Keep daily aggregates for 1 year

  # Logging
  - LOG_LEVEL=INFO                      # DEBUG, INFO, WARNING, ERROR
Restart to Apply Changes
docker compose down
docker compose up -d
Accessing eeroVista
Web Interface
- Dashboard:
http://localhost:8080/ - Devices:
http://localhost:8080/devices - Network:
http://localhost:8080/network - Speedtest History:
http://localhost:8080/speedtest
API Endpoints
- Prometheus Metrics:
http://localhost:8080/metrics - Health Check:
http://localhost:8080/api/health - Device List:
http://localhost:8080/api/devices
See API Reference for complete endpoint documentation.
What You’ll See
Dashboard
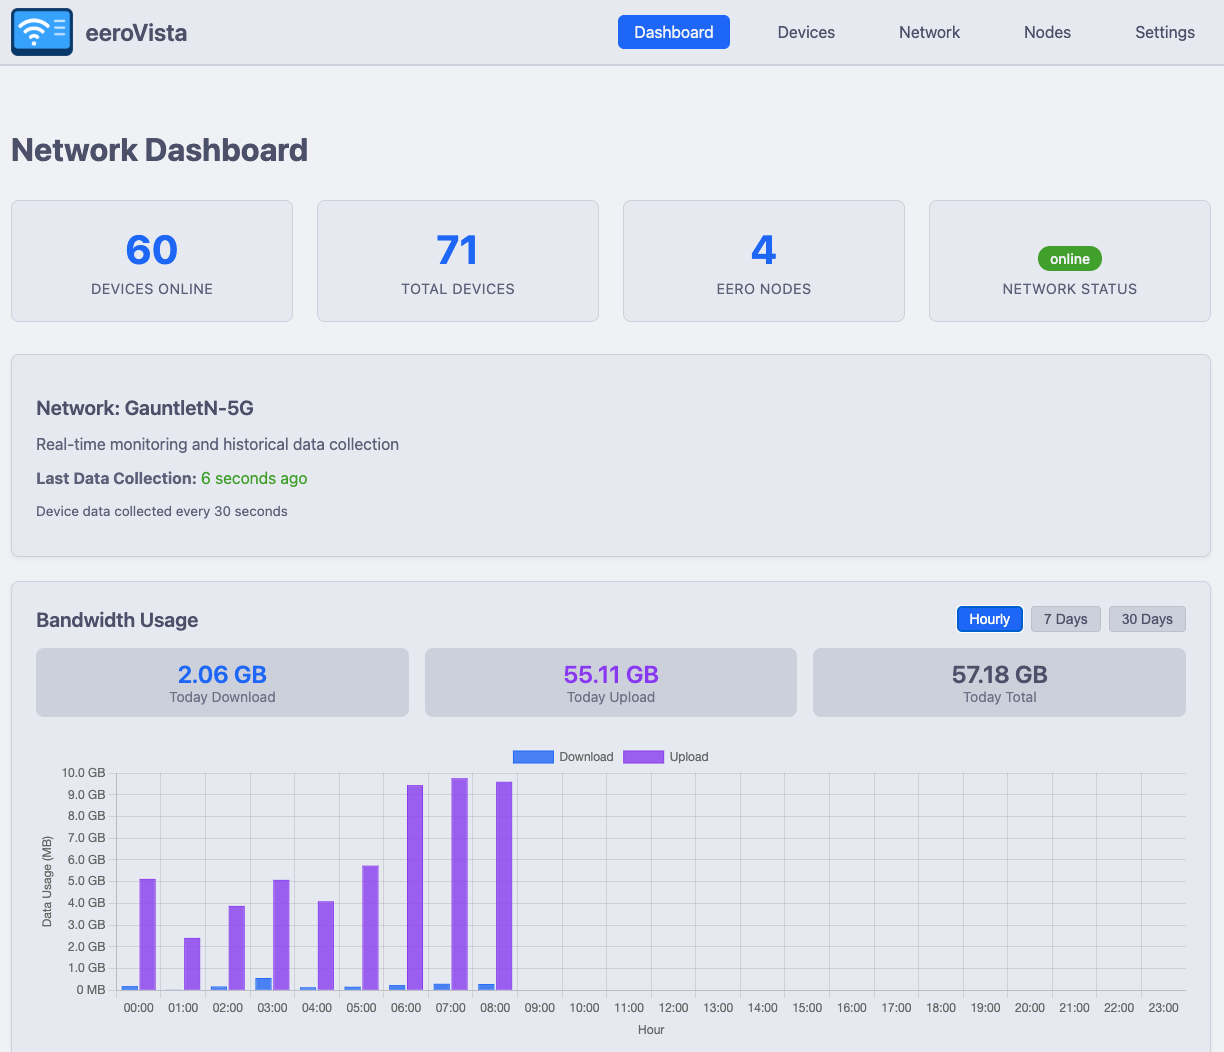
After initial data collection completes, the dashboard will display:
- Network Health Score (0-100) combining WAN uptime, node availability, mesh quality, and signal quality
- WAN Uptime percentage with outage count
- Real-time bandwidth usage graphs (hourly, 7-day, and 30-day views)
- Top bandwidth consumers
- Network statistics (online devices, total devices, WAN status)
- Recent speedtest results
Reports
The Reports page (http://localhost:8080/reports) provides:
- Bandwidth Summary Reports - Weekly or monthly totals with top devices and period-over-period comparison
- ISP Reliability - WAN uptime percentages (24h/7d/30d), daily uptime heatmap, and outage event log
Device List
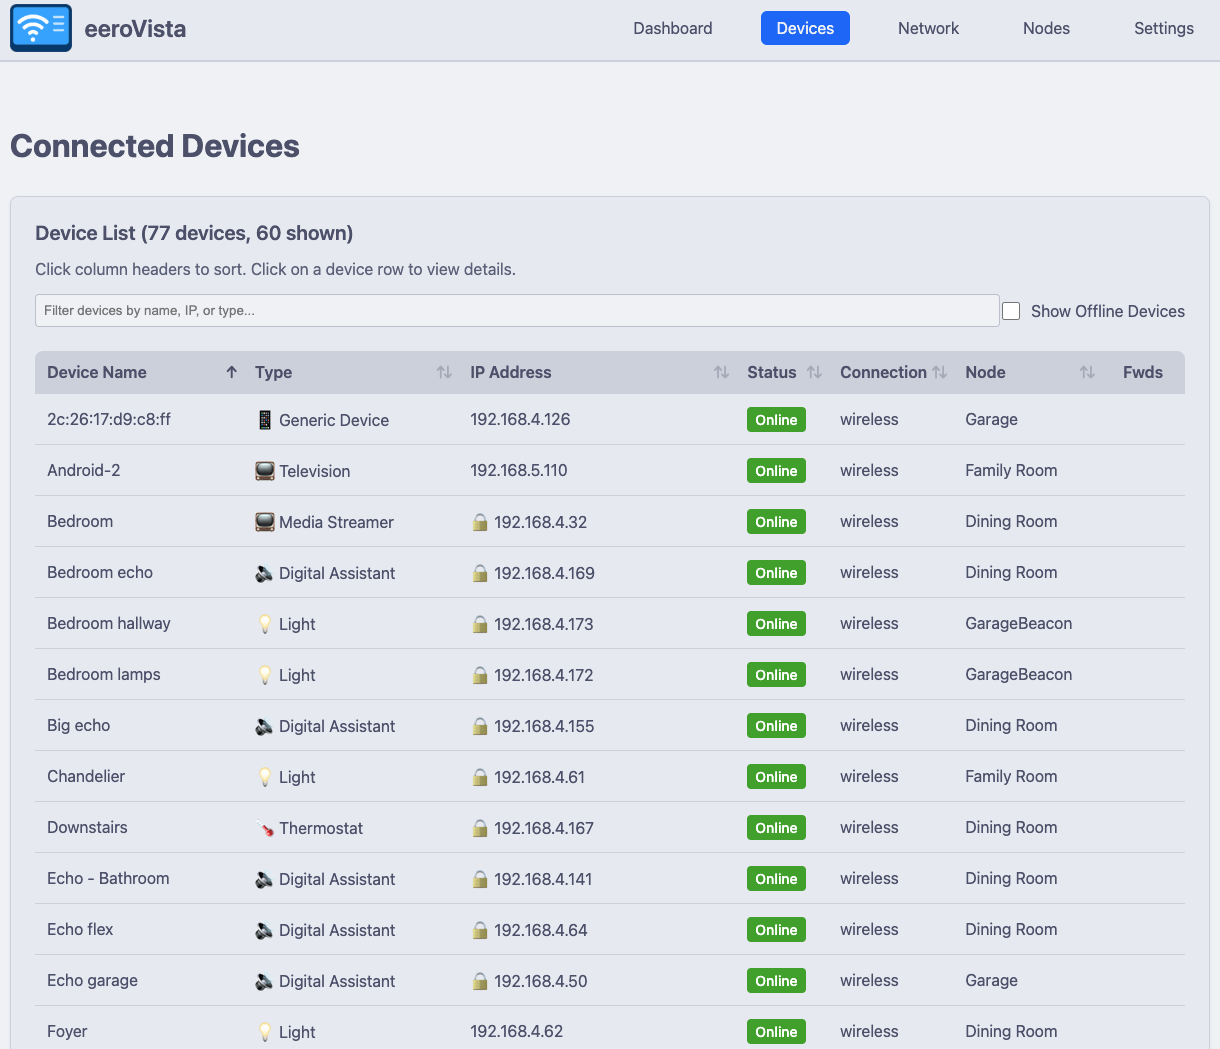
The Devices page shows all connected devices with:
- Connection status (online/offline)
- IP addresses with DHCP reservation indicators (🔒)
- Signal strength for wireless devices
- Port forwarding indicators (🔀)
- Sortable and filterable table
- Device grouping for combining multiple network interfaces
Device Groups
Many devices connect to your network over both wired and wireless interfaces, appearing as two separate entries. Device Groups let you combine these into a single logical device:
- Click Create Device Group on the Devices page
- Name the group and select the member devices
- Click Create Group
Grouped devices appear as a single row in the device table with aggregated bandwidth and a link icon (🔗). Click a group to see:
- Combined bandwidth chart with stacked bars showing each member’s contribution (blue = download, purple = upload)
- Hourly / 7-day / 30-day chart views
- Tabbed member details with full device info, DNS aliases, and port forwards for each member
You can edit or ungroup devices at any time from the group detail modal.
Troubleshooting
Authentication Issues
If authentication fails:
- Verify the phone number is correct (include country code if international)
- Check that you have mobile app access to your Eero network
- Ensure you’re receiving SMS codes
- Try clearing browser cache and retrying
Amazon Login Accounts: If your Eero account is linked to Amazon for login, direct authentication with eeroVista will not work due to API limitations.
Workaround: Create a separate Eero account using email/password authentication and have the account owner invite this new account as an admin to the network. Then use these credentials to authenticate eeroVista.
I See Devices But No Bandwidth Data
This is normal behavior. eeroVista cannot access historical bandwidth data from before it was started. Only data collected after the container launches will be tracked and displayed.
What to expect:
- Bandwidth graphs will be empty initially
- Data will begin appearing within 1-2 minutes of startup
- Historical graphs will build up over time (hourly, daily, weekly views)
- Device connection history starts fresh from container launch
Tip: Leave the container running continuously to build up historical data over days and weeks.
No Data Appearing
- Check logs for errors:
docker compose logs eerovista - Verify authentication succeeded:
docker compose exec eerovista cat /data/eerovista.db | grep session - Wait 2-3 minutes for initial data collection
Container Won’t Start
- Check port 8080 is not in use:
netstat -tlnp | grep 8080 - Verify data directory permissions:
ls -la data/ - Check Docker logs:
docker compose logs eerovista
Notifications
eeroVista supports configurable notifications for network events. To set up notifications:
- Go to the Settings page (
http://localhost:8080/settings) - Configure your Apprise URLs - these define where notifications are delivered (email, Slack, Discord, Telegram, webhooks, and 100+ other services via Apprise)
- Use Send Test to verify delivery works
- Create Notification Rules to define what triggers alerts:
- Node Offline: Alert when mesh nodes go down
- Device Offline: Alert when specific devices disconnect
- New Device: Alert when an unknown device joins the network
- High Bandwidth: Alert when bandwidth exceeds a threshold
- Firmware Update: Alert when firmware updates are available
- Each rule has a configurable cooldown period (default: 60 minutes) to prevent repeated alerts
Notification rules are evaluated every 60 seconds (configurable via NOTIFICATION_CHECK_INTERVAL).
Next Steps
- Configure notifications for network alerts
- Set up HTTPS with a reverse proxy for secure access
- Configure Prometheus to scrape metrics
- Set up Zabbix monitoring
- Explore the API for custom integrations
- Contribute to development
Support
For issues and questions:
- GitHub Issues: https://github.com/yeraze/eerovista/issues
- Discussions: https://github.com/yeraze/eerovista/discussions